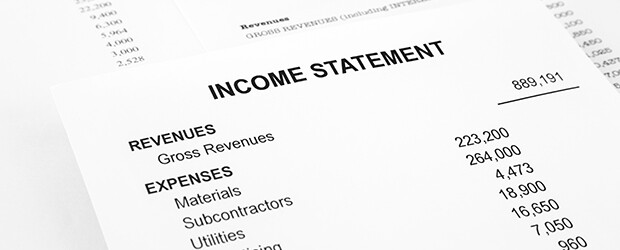
To understand where a company is going, you have to understand where it came from and how it's operating today. If someone needs to determine the profitability and growth potential of a business, the first place to begin is with its financial documents. Perhaps one of the most important of those documents, an income statement shows all of a company’s revenues and expenses and is a key indicator of how they'll perform in the future.1
Together, we’ll dive into the mechanics and format of an income statement so you can use its information to your advantage.
Income Statement Basics
There are three types of financial statements on which analysts, accountants, CFOs, and potential investors or lenders will rely. One is the company’s balance sheet. The second is the cash flow statement. The third key financial document is the income statement, which shows the company’s revenues and expenses over a monthly, quarterly, or annual period.1
An income statement is also known as a statement of earnings, a statement of operations, a revenue statement, or a profit and loss statement (P&L), and is used by financial professionals.1,2 From a company’s income statement, you can clearly see their sales and other revenue, costs, gross profit, administrative and sales expenditures, estimated taxes, net profit, and other income and expenses.1 All of this is essential information for the company’s financial officer and executive team, founders of a startup, a private investor thinking about putting money into a business venture, or a lender who must decide whether to approve a loan application.
Luckily for those who aren’t as mathematically inclined, these figures are arranged in a clean, logical way so that the business’s profitability and growth potential can be easily assessed, sometimes even at a cursory glance. An income statement also plainly shows where improvements can be made, such as reducing the cost of sales or daily operating costs.1
Who Uses an Income Statement?
An income statement is invaluable in accounting, corporate finance, and for anyone who invests. It’s also used internally so that a financial manager can forecast the company’s financial performance (known as financial modeling), inform strategies, and propose operational changes to the executive team if needed.2
Entrepreneurs thinking of starting their own business might look at the income statements of other businesses in their industry to see any potential pitfalls before they embark on their new venture.3 A small business owner, especially of a startup, will use quarterly—or even monthly—income statements to closely monitor the health of their fledgling enterprise. Having the most up-to-date information helps owners make informed, strategic decisions quickly and fix problems before they become expensive. With a highly detailed statement, it’s possible to pinpoint every business-related expense to see where to carve out savings. This is essential intelligence for a new company on a tight budget.4
The Importance of an Income Statement in Business
To have a clear and accurate record of a company’s profit and loss over periods of time is helpful for several reasons:
- Tracks profitability – Gives the owner, shareholders, and other stakeholders knowledge of where the company stands financially2
- Aids in decision-making – Increases owner awareness of the current financial status of the business; with accurate numbers, they can make faster and smarter decisions about new expenditures2
- Helps ensure tax compliance – Provides insight into the company’s future tax liability (along with cash flow statement and balance sheet)2
- Tracks increases in the cost of goods (COG) – Shows production or purchase expenses (as well as product returns) as a percentage of sales4
- Supports strategic planning – Provides essential information to help business leaders plan for their organization’s future by assessing its financial health, identifying growth opportunities, evaluating risk, allocating resources and monitoring progress5
- Informs decisions regarding mergers and acquisitions – “The income statement is the go-to document for potential acquirers when assessing a company’s profitability. It lays bare whether a company is in the black or red financially and also provides insights into growth prospects – a crucial factor for those eyeing sustainable future returns.”6
- Strengthens the benchmarking process – Business leaders can improve operating efficiency, build value and anticipate expected development in the marketplace7
Income statements are also used, in addition to balance sheets, by lenders (investors, banks, and vendors) to set credit limits when considering applications for business loans.4
The Multi-Step vs. Single-Step Format
In financial reporting, there are two income statement formats: single-step and multi-step. The difference between the two is that while the single-step statement shows the company’s pre-tax and after-tax income, the multi-step also includes gross income (after the cost of sales) and operating income (after selling, general, and administrative expenses). A multi-step income statement shows the company’s income at four key steps in their operations. It also breaks down the categories into detail so you can see exactly what contributed to profit or loss.1,3
Statement Formulas
The single-step income statement formula is simply:
Net Income = (Revenues + Gains) – (Expenses + Losses)2
The multi-step income statement formulas are:
Gross Profit = Net Sales – Cost of Goods Sold
Operating income = Gross Profit – Operating Expense
Net Income = Operating Income + Non-Operating Items2
How to Create an Income Statement
For the most comprehensive look at a company’s financial health, you should use the multi-step format for an income statement. The key elements are:
- Net sales/revenue: Company’s sales of goods and/or services to its customers
- Cost of goods sold (COGS): Cost of goods and products sold and cost of services rendered; this includes labor, materials and manufacturing costs. Depreciation is included here, though it may be found elsewhere. For retailers and wholesalers, this is the merchandise cost for resale
- Gross income: Also known as gross profit or gross margin; must be enough to cover other expenses
- Selling, general and administrative expenses (SG&A): Daily operational expenses; increasingly shown as a percentage of sales to monitor efficiency
- Operating income: Subtracting SG&A from Gross Income gives you the operating income: earnings from normal operations before non-operating income, taxes, interest and special expenses. Often used by analysts to indicate profitability (rather than net income)
- Interest expense: Costs of company’s loans; may be a net amount and include income from investments
- Income before taxes: Earnings before income tax expense; often a more accurate measure of profitability than reported income.
- Taxes: This is an estimate of tax liability, rather than paid taxes
- Special items or unusual expenses: May include non-recurring events, discontinued operations or restructuring charges; usually one-time occurrences
- Net income (after tax): Also known as net earnings or net profit, net income is a company’s “bottom line” and the most common profitability indicator. If expenses are greater than income, it is a net loss1
In creating an income statement, it’s important to avoid several common accounting mistakes. They include errors in:8
- Transposition: Reversing two digits, so that $1560 appears as $1650
- Rounding: Even small rounding mistakes can add up to large inaccuracies over time
- Omission: Completely leaving one or more transactions out of the records
- Commission: Recording an entry in the wrong area; for example, notating a utility expense as a rent expense
- Compensation: Two mistakes that cancel each other out; for example, a mistake in recording revenue that’s offset by a mistake in recording expenses
- Principle: Applying an accounting principle incorrectly; for example, recording a capital expenditure as a revenue expense
- Original entry: This highly common mistake involves incorrectly recording a starting figure, such as noting $75 as $750
Accounting software can help ensure the accuracy of your documents, as it effectively eliminates human error. Comprehensive record-keeping, regularly scheduled audits and reconciliation of accounts, clear delegation and communication of financial record-keeping responsibilities and, of course, assiduous proofreading of your documents are essential to avoiding mistakes.
How to Read an Income Statement
Income statements follow a logical path, from top to bottom. The top line is the company’s total revenue, before expenses, while the bottom line is the company’s total profit. This is why a business’s net sales or net income is known in the financial world as its bottom line.9
Whether you’re helping to improve company profits as a CFO, studying the financial decisions of successful competitors as a startup founder, or determining if a company is well positioned for future growth as an investor, being savvy with income statements gives you a distinct advantage.10
Understanding Financial Ratios in an Income Statement
Financial ratios are used to analyze different categories, such as company debt, liquidity and profitability. The most common ratios shown in an income statement include:11
Gross margin, which represents how much of a company's sales revenue it keeps after the direct costs of producing its goods and services. This ratio reflects the percentage of sales revenue available for profit or reinvestment after the deduction of cost of goods sold (COGS). If, for example, a company has a gross margin of 50%, it keeps 50 cents for every dollar it makes. It uses the remainder on operating expenses.
Profit margin, which shows the profit per sale after the deduction of all other expenses. It also indicates how many cents a company generates in profit for each dollar of sale. If your company reported a 45% profit margin, its net income was 45 cents for every dollar generated.
Operating margin, which shows the amount left over after payment of variable costs, such as raw materials and employee wages. The operating margin is the same as the company's return on sales; it indicates how well that return is being managed.
Earnings per share (EPS), which is an essential determinant of the price of a company's shares. EPS is the result of net income less dividends on preferred stock—which is then divided by average outstanding shares. A higher EPS translates to greater value, as a company with higher profits is more likely to draw investors. When determining which stocks they favor, many investors look at EPS by comparing the ratio with the share price. This helps them see the value of earnings, which can be indicative of a company's future growth.
The price-earnings (P/E) ratio, often called the price multiple, generally shows how much investors pay per dollar of earnings. It’s calculated by taking market value per share divided by earnings per share. A company with a high P/E ratio may have a high share price relative to earnings, which could mean that it’s overvalued. Conversely a low P/E may indicate that the company’s stock price is low relative to its earnings.
Times interest earned (TIE), which shows a company's ability to meet debt payments. Determine the TIE by dividing earnings before interest and taxes, or EBIT, by total annual interest expenses.
Return on stockholders' equity, which reflects the percentage of profit after taxes that the corporation earned. This is also a critical valuation for shareholders and potential investors. Among several ways to calculate it, one can divide net income after taxes by weighted average equity.
Horizontal and Vertical Analysis
Also known as trend analysis, horizontal analysis is a method to assess trends in financial data over a stretch of years. It involves comparing line items in financial documents, such as income statements, across consecutive time periods.
Vertical analysis, by contrast, identifies the proportional relationship between multiple line items by centering on a specific reporting period. Often called common-size financial statement analysis, it shows each line item as a percentage of a base figure—often the total revenue or assets involved.
Use this chart to consider the core differences between horizontal and vertical analysis:12
Build From the Basics for a Successful Career
The online MBA from the Yeshiva University Sy Syms School of Business can help you reach your professional goals. With decades of experience to their credit, YU’s faculty of authorities will teach you how to build business relationships and transform your ideas into successful startups. The rigorous curriculum is built on three core pillars—Entrepreneurship, Essential Business Skills and Relationships—and it instills the skills you need to adapt to an ever-changing business landscape.
Don’t wait to put real strength into your career. Schedule a call with an admissions outreach advisor today.
- Retrieved on August 27, 2024, from investopedia.com/articles/04/022504.asp
- Retrieved on August 27, 2024, from deskera.com/blog/income-statement/
- Retrieved on August 27, 2024, from thestreet.com/personal-finance/education/what-is-an-income-statement-14899351
- Retrieved on August 27, 2024, from inc.com/articles/2000/05/18739.html
- Retrieved on August 27, 2024, from imarticus.org/blog/the-link-between-financial-analysis-and-strategic-planning/
- Retrieved on August 27, 2024, from acquinoxadvisors.com/understanding-financial-statements-in-ma/#
- Retrieved on August 27, 2024, from blog.ssb-cpa.com/news/financial-benchmarking-for-success
- Retrieved on August 27, 2024, from accountantseastlondon.com/blog/accounting-errors-how-to-avoid-them/
- Retrieved on August 27, 2024, from bench.co/blog/accounting/how-to-read-income-statement/
- Retrieved on August 27, 2024, from zoho.com/books/guides/what-is-an-income-statement.html
- Retrieved on August 27, 2024, from investopedia.com/ask/answers/102714/what-are-main-income-statement-ratios.asp
- Retrieved on August 27, 2024, from timespro.com/blog/everything-you-need-to-know-about-horizontal-and-vertical-analysis